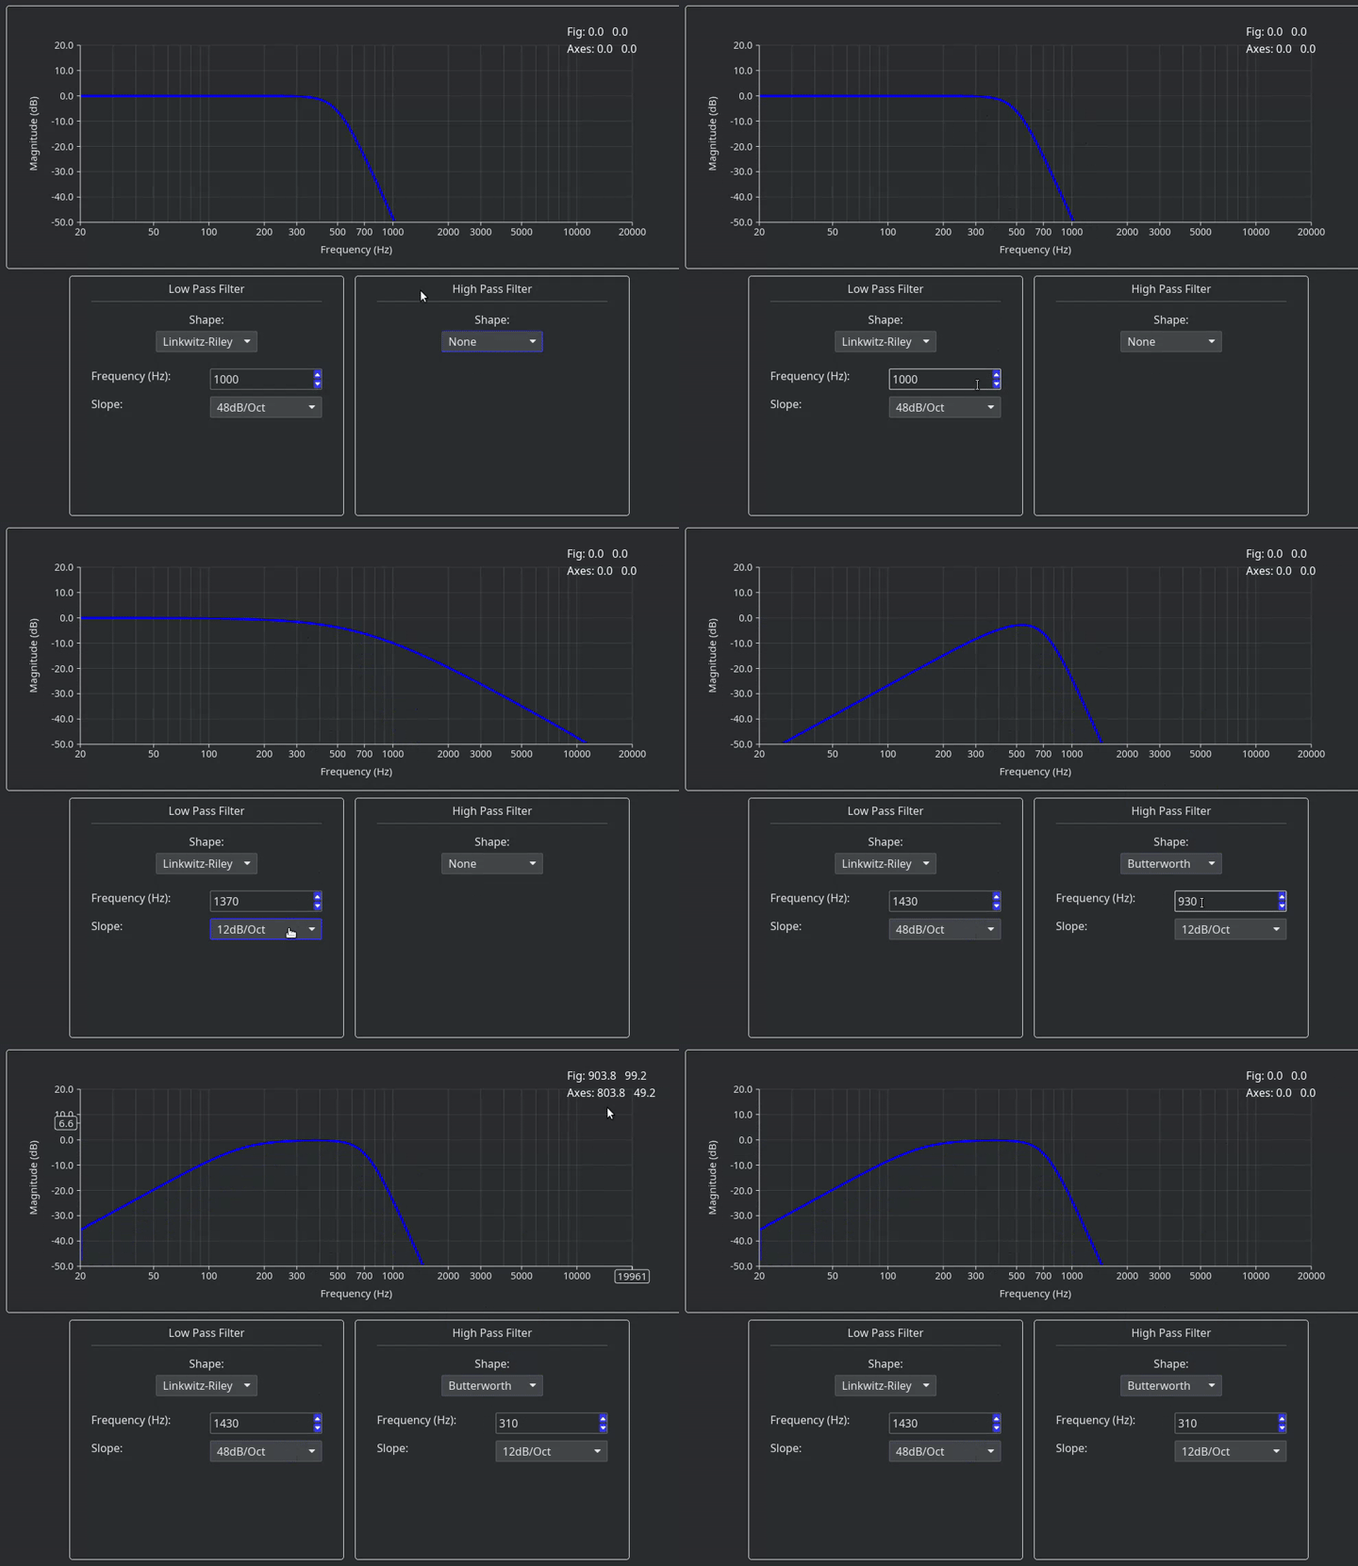
First up, here’s a little gif of what I’ve got so far, and this post is specifically referring to the implementation of the chart widget in the top half of the screen.

I initially implemented the chart as just a canvas with canvas::Program, but I wanted a bit more control over things so I’ve swapped over to impl’ing Widget instead.
I’ve sort of taken some inspiration from the TextEditor widget in terms of holding on to the data that the chart displays, so the widget’s new method takes a reference to a Data struct, which itself looks like this:
pub struct Data {
    traces: Vec<Vec<(u32, f32)>>,  // line-series data coordinates
    cache: canvas::Cache<Renderer>,
    traces_cache: canvas::Cache<Renderer>,
    tick_labels_overlay_cache: canvas::Cache<Renderer>,
}
Users can add/remove line-series data (“traces”) by using methods on the Data struct in their update function. Here’s a minimal example of how the widget would be used:
pub struct ChartScreen {
    chart_data: Data
}

impl ChartScreen {
    fn new() -> Self {
        // the parent screen just maintains the `Data` of the chart
        let chart_data = Data::new();

        Self {
            chart_data
        }
    }

    fn update(&mut self, message: Message) {
        match message {
            Message::ParameterChanged(new_param) => {
                let line_series = /compute_new_line_series_data/;
                // the user can set the data they want to display here
                self.chart_data.set_trace(line_series);
            }
        }
    }

    fn view(&self) -> Element<'a, Message> {
        // the widget itself is created in the `view` function, here, taking only a reference to
        // the data that it is displaying
        let chart = Chart::new(&self.chart_data);
        let form_for_configuring_parameters = ...;

        column![
            chart,
            form_for_configuring_parameters
        ]
    }
}
I only do minimal layouting in Widget::layout, which returns a Node defining the size of the whole widget, containing a single child Node representing the the actual plotting area within the x and y axes. The position of labels on the axes is calculated/hard-coded in the Widget::draw method. Furthermore, all drawing is done using Canvas::Cache s - you can see from my Data struct that I have split these for efficiency purposes - for example, when the user changes the parameters for the trace they want to display, the trace will update, but the static axes/labels on the chart remain cached.
I’m happy with the end result so far, but I am aware that my implementation is basically quite naive. I’m now looking to add more functionality to the widget, such as incorporating a button that will toggle the appearance of a secondary Y axis, making it possible to zoom/move the chart area, etc, but before I add too much extra complexity, I want to make sure I’m building on top of a reasonable framework.
In particular:
- Is doing all drawing using
canvas::Cachesa reasonable approach? At minimum I need to draw the line-series data on aCanvasbecause a bog standard renderer can only drawQuadsandText, but the rest doesn’t necessarily need to be aCanvas, I think. - Is storing the
canvas::Cachein the user-ownedDatastruct ok, or should I actually move that to an internalStatestruct within the widget? (the chart currently has an internalState, but I only use it for tracking cursor position at the moment). - Is storing the user-defined line-series data on the
Datastruct the correct approach?